Repeats
<<<<<<< HEAD2021-11-02
=======2021-12-13
>>>>>>> 1f72b2c38317bbf9e22e15671a199f851eaded2e1 Setup
1.1 Load libraries
library(here)
source(here::here("code/scripts/repeats/source.R"))
Working directory on EBI cluster: /hps/research1/birney/users/ian/mikk_paper
1.2 Get Jack’s data
Jack’s directory here: /nfs/leia/research/enright/jack/10_medaka_fish/02_genome_repeats/repeatmasker_filtered/medaka_hdrr
# Create directory for repeats work
mkdir repeats
# Pull data over from Jack's repo via local
scp brettell@yoda:/nfs/leia/research/enright/jack/10_medaka_fish/02_genome_repeats/repeatmasker_filtered/medaka_hdrr/processed/medaka_hdrr_repeats.fixed.gff ~/Documents/Repositories/mikk_genome/data

scp ~/Desktop/medaka_hdrr_repeats.fixed.gff brettell@ebi:/hps/research1/birney/users/ian/mikk_paper/repeats
1.3 Read in data and clean
# Read in data
hdrr_reps = read.table(file.path(lts_dir, "medaka_hdrr_repeats.fixed.gff"),
                       header = F, sep = "\t", skip = 3, comment.char = "", quote = "", as.is = T) %>%
  # Remove empty V8 column
  dplyr::select(-V8) %>%
  # Get class of repeat from third column
  dplyr::mutate(class = stringr::str_split(V3, pattern = "#", simplify = T)[, 1]) %>%
  # Rename columns
  dplyr::rename(chr = V1, tool = V2, class_full = V3, start = V4, end = V5, percent = V6, strand = V7, info = V9)

DT::datatable(head(hdrr_reps, 100))# Find types of class other than "(GATCCA)n" types
class_types = unique(hdrr_reps$class[grep(")n", hdrr_reps$class, invert = T)])
class_types[1] “DNA” “Unknown” “SINE” “LINE” “LTR” “Simple_repeat” “Satellite” “RC” “tRNA”
[10] “rRNA” “Retroposon” “snRNA” "" “buffer” “ARTEFACT” “scRNA”
# Find types of class other than "(GATCCA)n" types
class_types = unique(hdrr_reps$class[grep(")n", hdrr_reps$class, invert = T)])
class_types
[1] “DNA” “Unknown” “SINE” “LINE” “LTR” “Simple_repeat” “Satellite”
[8] “RC” “tRNA” “rRNA” “Retroposon” “snRNA” "" “buffer”
[15] “ARTEFACT” “scRNA”
# How many in the blank class?
length(which(hdrr_reps$class == ""))
[1] 8
# Recode class
hdrr_reps = hdrr_reps %>%
  # NA for blanks
  dplyr::mutate(class = dplyr::na_if(class, "")) %>%
  # "misc" for others in "(GATCCA)n" type classes
  dplyr::mutate(class = dplyr::if_else(!class %in% class_types, "Misc.", class)) %>%
  # rename "Simple_repeat"
  dplyr::mutate(class = dplyr::recode(class, "Simple_repeat" = "Simple repeat"))

DT::datatable(head(hdrr_reps, 1000))2 Plot
# How many repeats in each category?
hdrr_reps %>%
  count(class) %>%
DT::datatable(., options = list(pageLength = nrow(.)))2.1 Circos
2.1.1 Clean data
# Exclude classes with very few counts
excluded_classes = c("ARTEFACT", "buffer", "scRNA", "snRNA")

plot_list = hdrr_reps %>%
  dplyr::mutate(chr = paste("chr", chr, sep = ""),
                chr = factor(chr, levels = chr_order),
                strand = factor(strand, levels = strand_order)) %>%
  dplyr::filter(!class %in% excluded_classes) %>%
#  dplyr::filter(strand == "+") %>%
#  dplyr::slice_sample(n = 20000) %>%
  # sort
  dplyr::arrange(class, strand, chr, start) %>%
  # get length and log length of repeats
  dplyr::mutate(length = end - start + 1,
                log_length = log(length)) %>%
  dplyr::select(chr, start, end, strand, class, length, log_length) %>%
  # remove the couple of rows with NA in `chr` column
  na.omit(.)

# Get max lengths for each class (rounded up to the nearest 1000)
max_lengths_df = plot_list %>%
  dplyr::group_by(class) %>%
  dplyr::summarise(max = round.choose(max(length), 1e3, dir = 1)) %>%
  dplyr::arrange(desc(max))

max_lengths = max_lengths_df %>%
  dplyr::pull(max)

class_order = max_lengths_df %>%
  dplyr::pull(class)

# Change order for best
class_order = c("Misc.",
                "LINE",
                "DNA",
                "LTR",
                "Unknown",
                "RC",
                "Satellite",
                "rRNA",
                "Simple repeat",
                "SINE",
                "tRNA",
                "Retroposon")

# Order by longest repeats
plot_list = plot_list %>%
  dplyr::mutate(class = factor(class, levels = class_order))

# Split by class and strand
plot_list = plot_list %>%
  split(., .$class) %>%
  lapply(., function(class){
    out = split(class, class$strand)

    return(out)
  })
2.1.2 Convert reverse strand densities to negative values for plotting
plot_list = lapply(plot_list, function(class){
  lapply(class, function(strand){
    strand %>%
      dplyr::mutate(length = ifelse(strand == "-",
                                        length * -1,
                                        length)) %>%
      # choose target values
      dplyr::select(chr, start, end, length)
  })
})

# True
test = plot_list
2.1.3 Save plot
out_plot = here::here("docs/plots/repeats/20210302_hdrr_repeats_true.png")
png(out_plot,
    width = 20,
    height = 20,
    units = "cm",
    res = 400)

# Choose palette
pal = grDevices::colorRampPalette(pal_electroangler)(length(test))

# Set parameters
## Decrease cell padding from default c(0.02, 1.00, 0.02, 1.00)
circos.par(cell.padding = c(0, 0, 0, 0),
           track.margin = c(0, 0),
           gap.degree = c(rep(1, nrow(chroms) - 1), 11))

# Initialize plot
circos.initializeWithIdeogram(chroms,
                              plotType = c("axis", "labels"),
                              major.by = 1e7,
                              axis.labels.cex = 0.25*par("cex"))

counter_class = 0
lapply(test, function(class){
  # set counter_class
  counter_class <<- counter_class + 1
  # set max ylim
  max_length = max_lengths[counter_class]
  counter = 0
  lapply(class, function(strand){
    # Set counter
    counter <<- counter + 1
    # Set y-limits for both strands
    if (names(class)[counter] == "+"){
      ylim = c(0, max_length)
    }
    else if (names(class)[counter] == "-"){
      ylim = c(-max_length, 0)
    }

    # Add track
    circos.genomicTrack(strand,
      panel.fun = function(region, value, ...) {
        circos.genomicLines(region,
                            value,
                            type = "h",
                            col = pal[counter_class],
                            cex = 0.05,
                            baseline = 0)
      },
      track.height = 0.03,
      ylim = ylim,
      bg.border = NA)

    # Add labels
    if (names(class)[counter] == "+"){
      # y-axis
      circos.yaxis(side = "right",
                   at = ylim,
                   labels.cex = 0.2*par("cex"),
                   tick.length = 2
                   )

      # strand
      circos.text(0, max_length / 2,
                  labels = "+",
                  sector.index = "chr1",
                  cex = 0.4*par("cex"))
    } else if (names(class)[counter] == "-"){
      # strand
      circos.text(0, -(max_length / 2),
                  labels = "-",
                  sector.index = "chr1",
                  cex = 0.4*par("cex"))
      # repeat class
      circos.text(0, 0,
                  labels = names(test)[counter_class],
                  facing = "clockwise",
                  adj = c(0.5, -0.5),
                  sector.index = "chr1",
                  cex = 0.25*par("cex"))
    }

  })

})

circos.clear()

dev.off()knitr::include_graphics(here::here("docs/plots/repeats/20210302_hdrr_repeats_true.png"))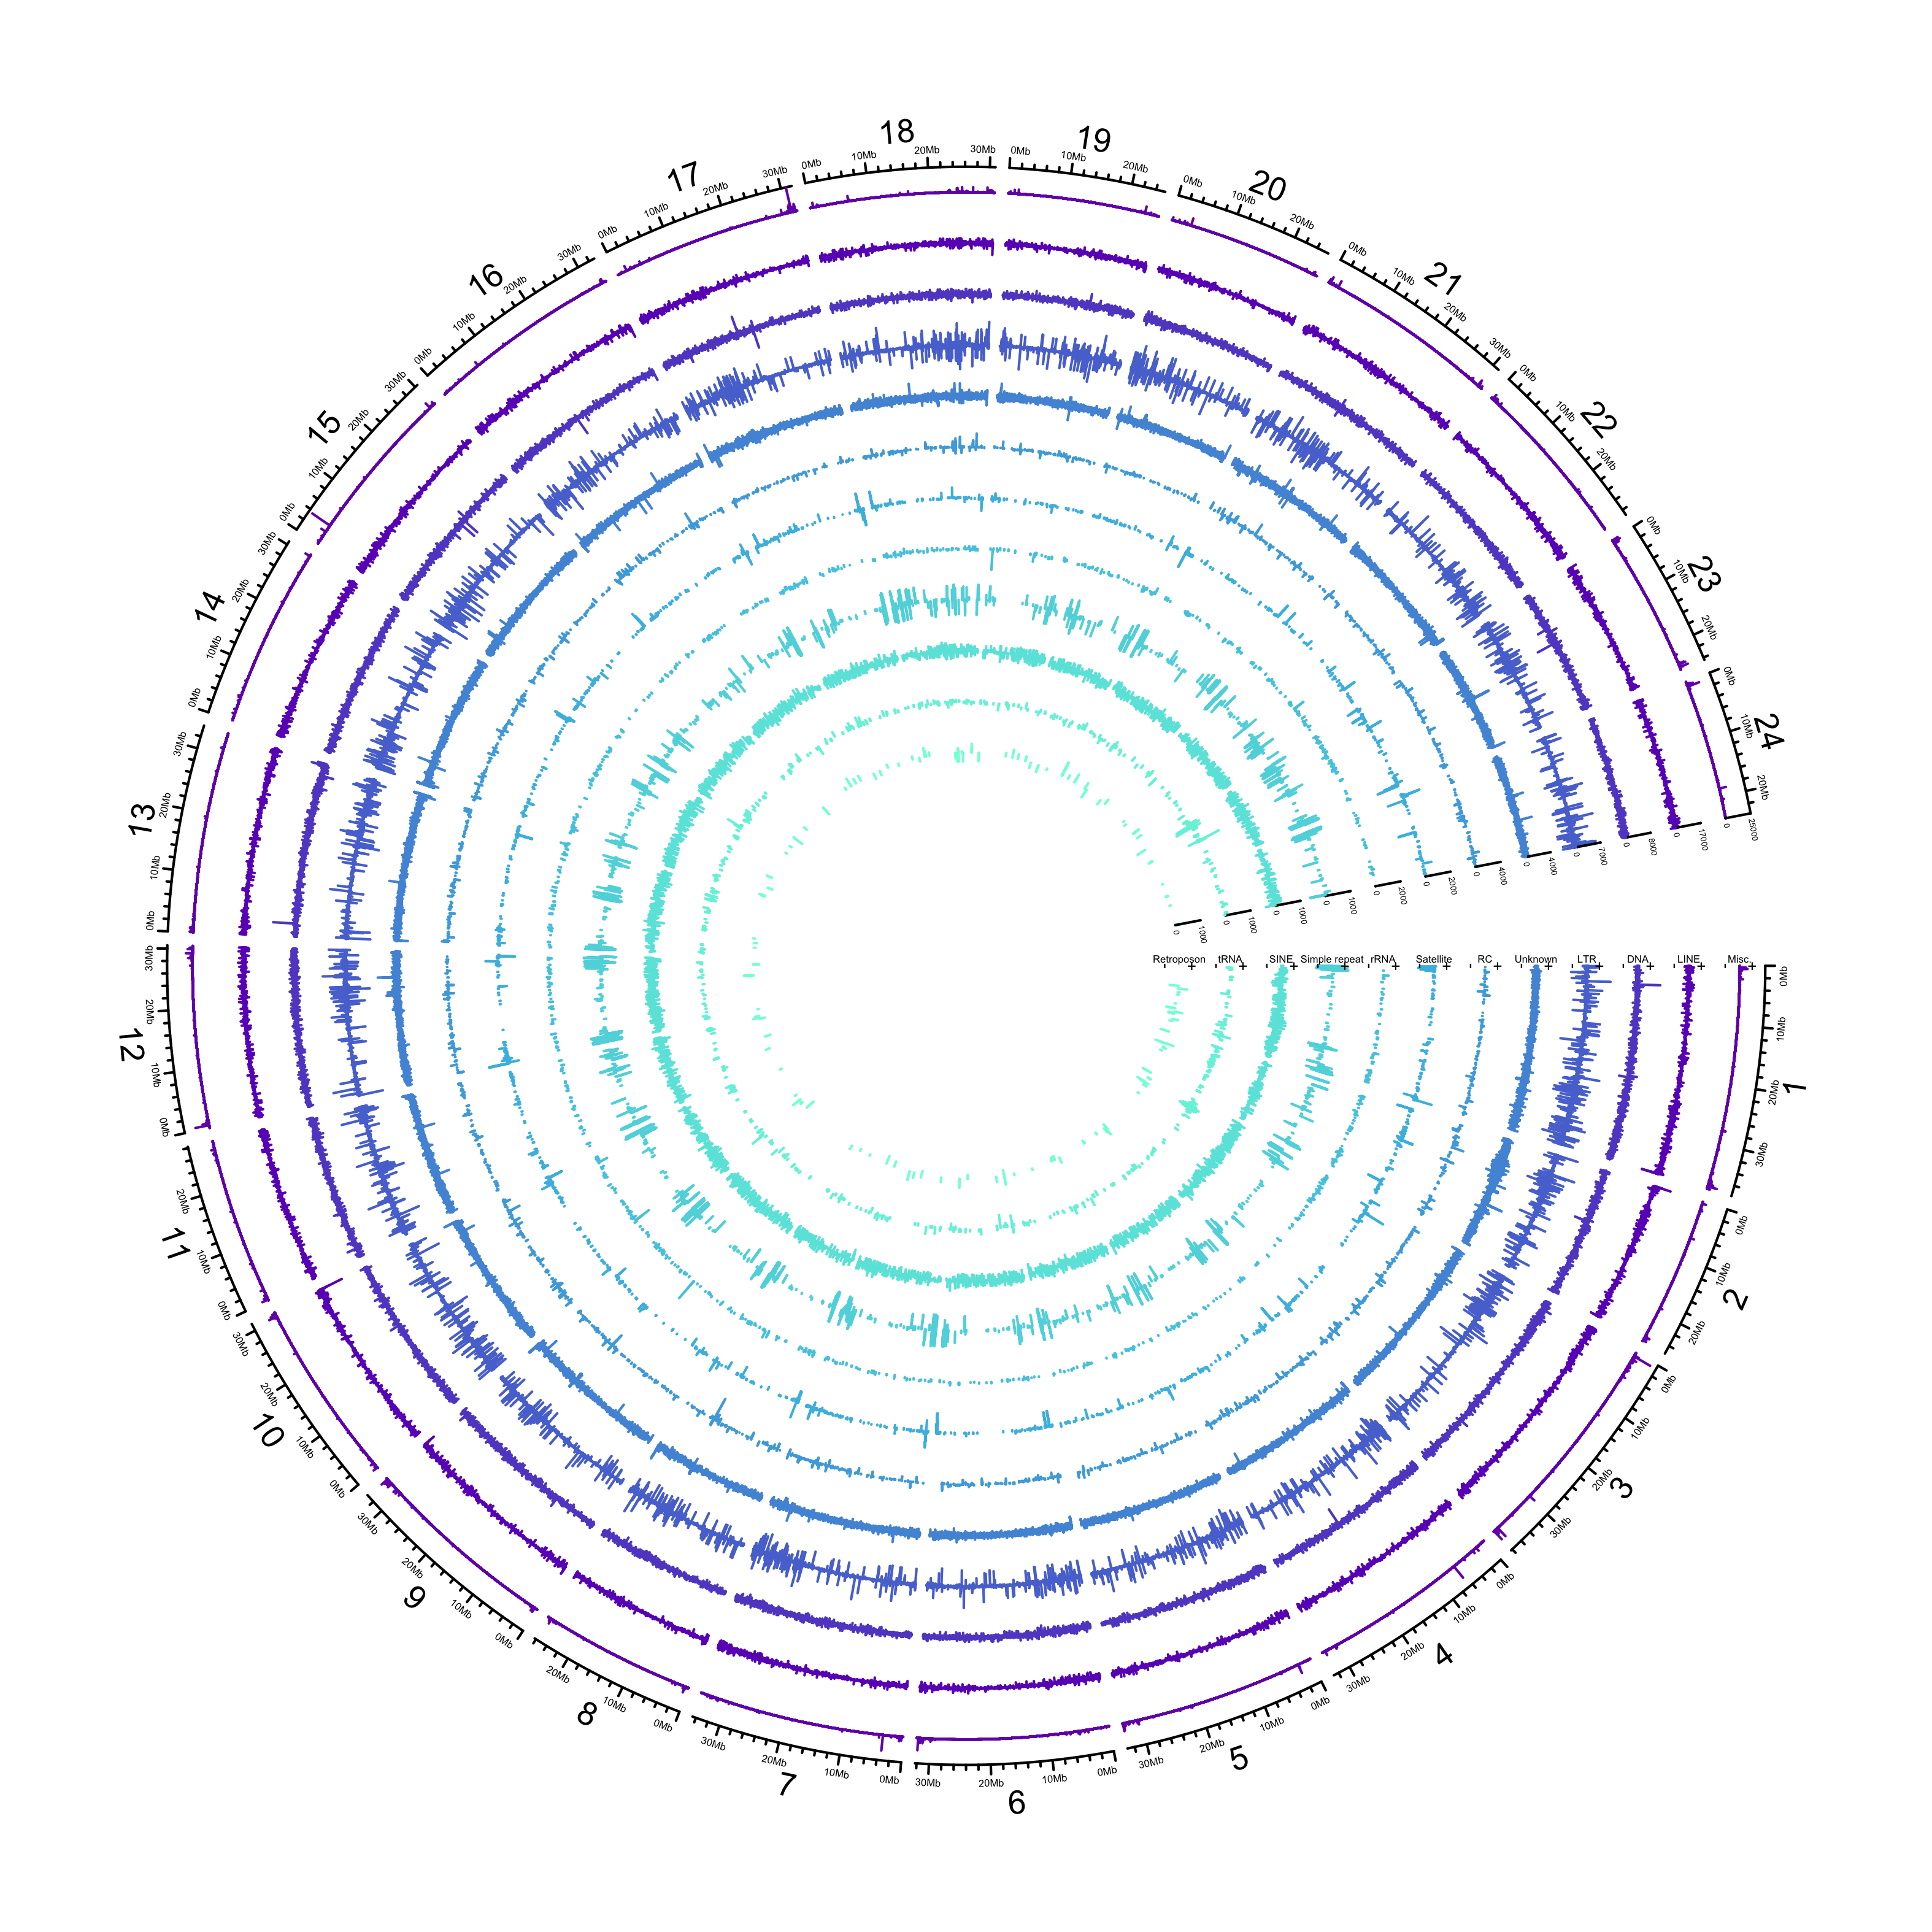
2.2 Coverage of region by repeats
# Get sequence of start to end for each chr
cov_list = hdrr_reps %>%
  dplyr::filter(chr != "MT") %>%
  dplyr::mutate(chr = factor(chr, levels = 1:24)) %>%
  split(., f = .$chr)

#
tmp = lapply(cov_list, function(chr){
  apply(chr, 1, function(x){
    seq(x[["start"]], x[["end"]])
  }) %>%
    unlist(.) %>%
    sort(.) %>%
    unique(.) %>%
    length(.)
})

repeat_cov = data.frame(CHR = names(tmp),
                        REP_COV = unlist(tmp))

repeat_cov = repeat_cov %>%
  dplyr::filter(is.na(CHR) == F) %>%
  dplyr::mutate(CHR = paste("chr", CHR, sep = "")) %>%
  dplyr::full_join(y = chroms, by = c("CHR" = "chr")) %>%
  dplyr::mutate(CHR = str_replace(CHR, "chr", ""),
                CHR = factor(CHR, levels = 1:24)) %>%
  dplyr::select(CHR, START = start, END = end, REP_COV) %>%
  dplyr::mutate(REP_PROP = REP_COV/END)
Plot
repeat_cov_plot = repeat_cov %>%
  ggplot() +
    geom_col(aes(CHR, REP_PROP, fill = CHR)) +
    theme_cowplot(font_size = 10) +
    guides(fill = F) +
    xlab("Chromosome") +
    ylab("Proportion of chromosome\ncovered by repeats")
## Warning: `guides(<scale> = FALSE)` is deprecated. Please use `guides(<scale> = "none")` instead.repeat_cov_plot 
2.3 Histograms of log repeat length
pal = grDevices::colorRampPalette(pal_electroangler)(length(plot_list))

hist_df = lapply(plot_list, function(class){
  dplyr::bind_rows(class, .id = "strand")
}) %>%
  dplyr::bind_rows(.id = "class") %>%
  dplyr::mutate(class = factor(class, levels = class_order),
                length = ifelse(length < 0, length * -1, length))

hist_plot = hist_df %>%
  ggplot(aes(x = log10(length),
                  # remove values under 0 created by the log10
                  y = ifelse(log10(..count..) < 0,
                             0,
                             log10(..count..)),
                  fill = class,
                  colour = class)) +
    geom_area(stat = "bin",
              bins = 20) +
#    geom_freqpoly(aes(colour = class)) +
    facet_wrap(~class, nrow = 3, ncol = 4) +
    scale_fill_manual(values = pal) +
    scale_colour_manual(values = karyoploteR::darker(pal)) +
    guides(fill = F) +
    guides(colour = F) +
    xlab(expression(log[10](length))) +
    ylab(expression(log[10](count))) +
    theme_cowplot(font_size = 10) +
    theme(strip.background = element_blank())
## Warning: `guides(<scale> = FALSE)` is deprecated. Please use `guides(<scale> = "none")` instead.
## Warning: `guides(<scale> = FALSE)` is deprecated. Please use `guides(<scale> = "none")` instead.hist_plot
2.4 Compile into final figure
circos_repeats_path = here::here("plots", "repeats", "20210302_hdrr_repeats_true.png")

final_svtype = ggdraw() +
  draw_image(circos_repeats_path,
             x = 0, y = 0, width = 1, height = .75, scale = 1.12) +
  draw_plot(repeat_cov_plot,
            x = 0, y = .75, width = .4, height = .25) +
  draw_plot(hist_plot,
            x = .4, y = .75, width = .6, height = .25) +
  draw_plot_label(label = c("A", "B", "C"), size = 25,
                  x = c(0, .39, 0), y = c(1, 1, .75),
                  hjust = c(-.25, 0, -.25),
                  color = "#4f0943")

final_svtype
ggsave(here::here("plots", "repeats", "20210401_hdrr_repeats_final.png"),
       device = "png",
       dpi = 400,
       units = "cm",
       width = 30,
       height = 42)